System Information window
The Procexp’s System Information window is similar to Windows Task Manager. This window can be accessed by choosing View > System Information or using the Ctrl+i shortcut:
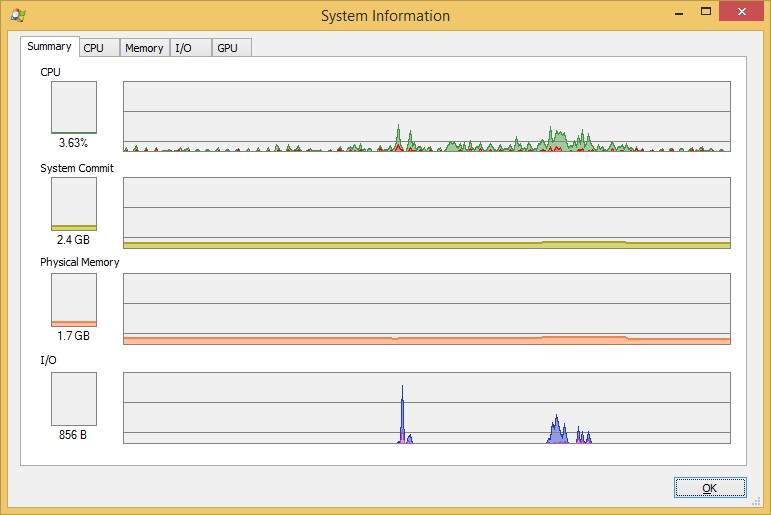
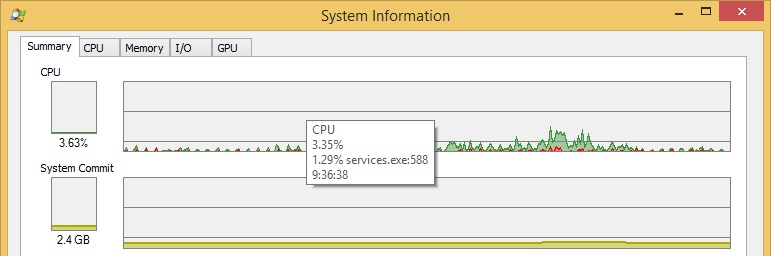
As you can ssee in the picture above, the Summary tab features four pairs of graphs representing system-wide metrics that are shown in more detail under the CPU, Memory, and I/O tabs. The left of each pair shows the current level in graphical and numeric form. The graph to its right shows recent history. Moving the mouse over the history graphs displays a tooltip containing the time of day represented at that point in the graph. For the CPU Usage and I/O graphs, the tooltip also indicates which process was consuming the most of that resource at that point in time:
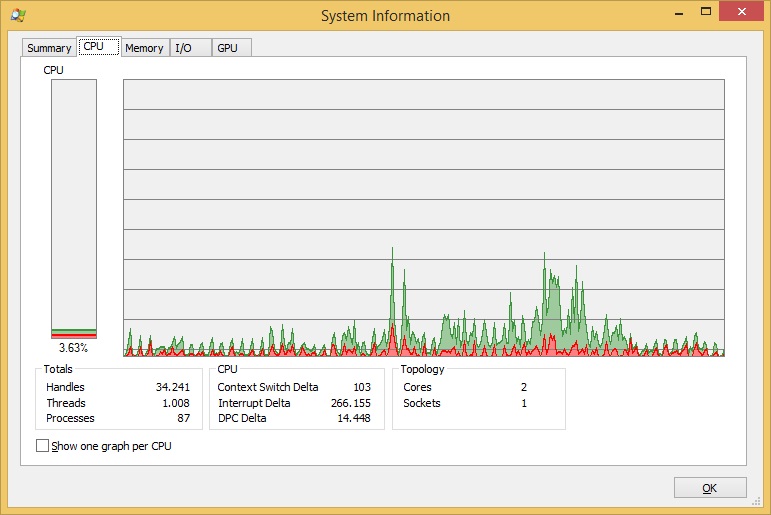
In the CPU tab of the System Information window, the red area displays the percentage of time spent executing in kernel mode; the area under the green line represents total CPU utilization as a percentage:
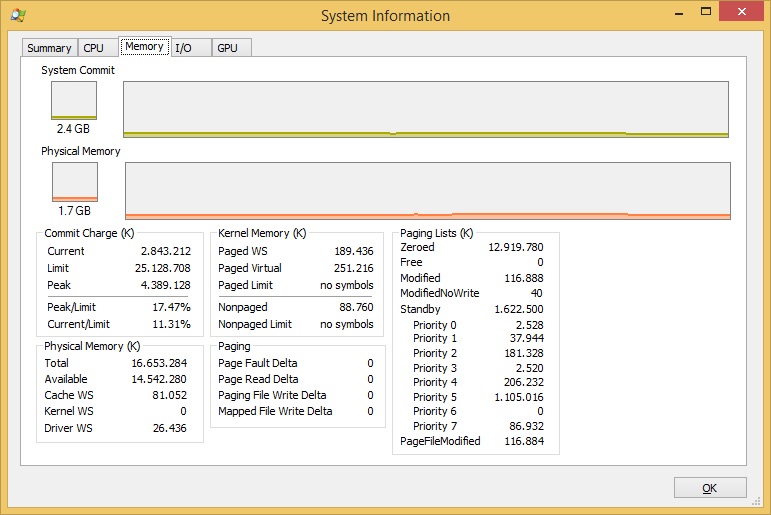
The Memory tab of the System Information window displays the System Commit and Physical Memory graphs. In the Commit graphs, the area under the yellow line indicates the commit charge – the total amount of private bytes committed across all processes, plus the paged pool. The Physical Memory graphs displays the amount of physical RAM in use by the system. The lower part of the tab shows a number of memory-related metrics:
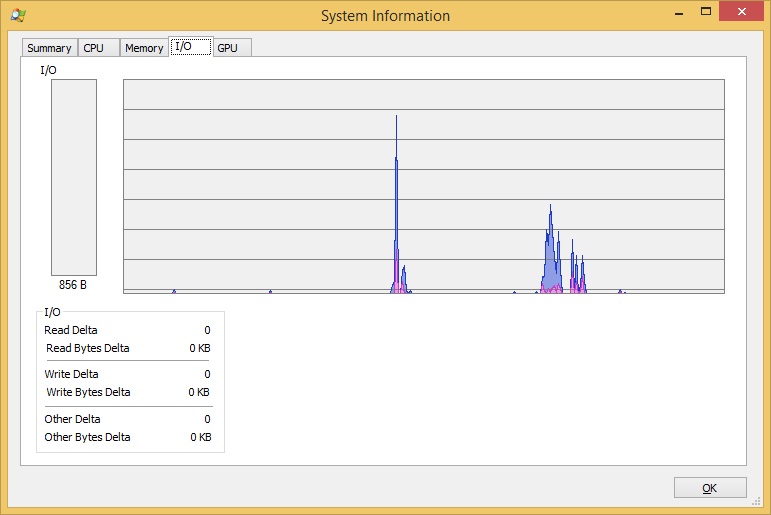
The I/O tab of the System Information window shows I/O Bytes, Network Bytes and Disk Bytes. I/O Bytes represents the amount of file and device I/O throughput, Network Bytes represents network I/O, and Disk Bytes represents the I/O throughput to local disks. The lower part of this tab shows the number of I/O and Disk Read, Write, and Other operations and Network Receive, Send, and Other operations since the last data refresh:
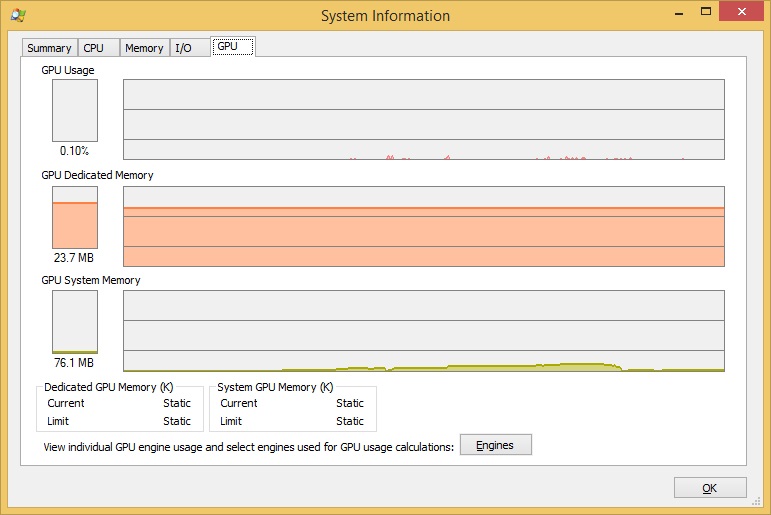
On Windows Vista or higher systems, there is also a GPU tab, which features GPU graphs that show GPU utilization: