Performance Graph
The Performance Graph contains performance graphs similar to the ones found in Task Manager:
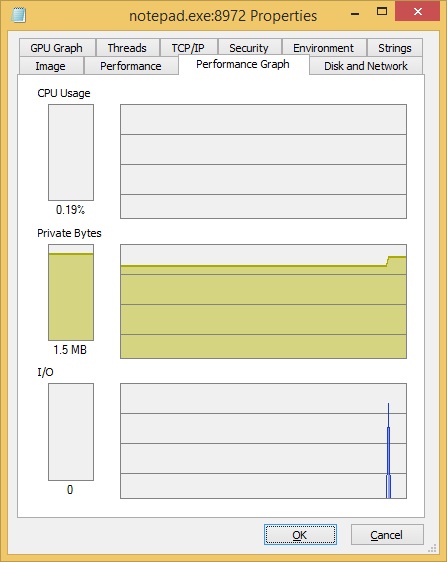
The graph on top displays the recent CPU usage history. Moving the mouse over this graph displays a tooltip with the percentage of the total CPU time consumed by the process at that time, along with the time of day that part of the graph represents. Note that the graph does not distinguish between multiple CPUs.
The Private Bytes graph shows the recent history of the amount of the process’ committed private bytes (the number of bytes allocated and committed by the process for its own use).
The third graph represents the process’ file and device I/O throughput history. The blue line indicates the total I/O traffic, which is the sum of all process I/O reads and writes and the pink line shows write traffic.