Default Procexp tree view
When you run Process Explorer, you are presented with the default Procexp window. This window consists of a process list, with processes arranged in a tree view:
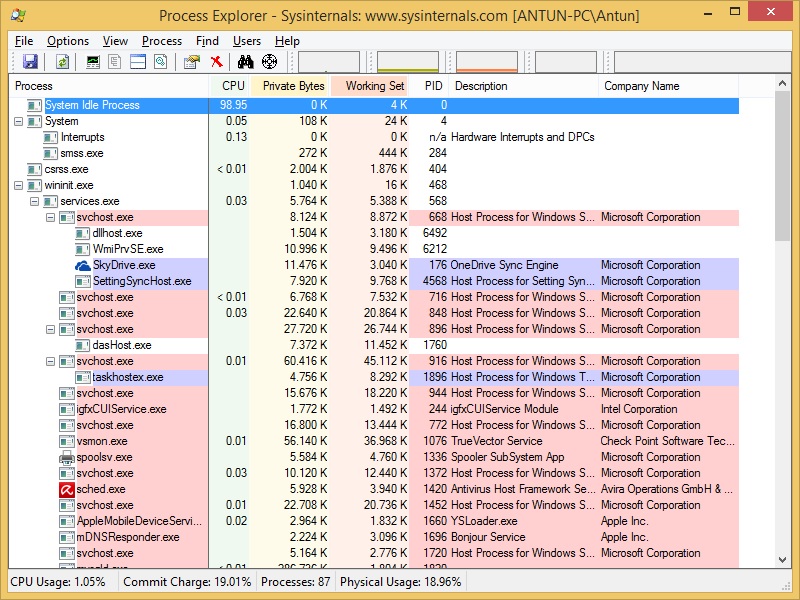
On the top of the toolbar there are activity graphs showing the CPU, memory, I/O, network and disk usage. These graphs can be clicked on to be displayed in separate windows. In the main window, you have a set of columns which includes:
• Process – the file name of the executable (along with the icon if one exists).
• CPU – the percentage of CPU time (rounded to two decimal places) in the last second.
• Private Bytes – the amount of memory allocated to the program alone.
• Working Set – the amount of actual RAM allocated to the program.
• PID – the process identifier that uniquely identifies an active process.
• Description – the description of the process, if available.
• Company Name – the name of the company that created the software behind the process.
You can customize these columns and add others, or you can click on any of the columns to sort by that field. The view is updated once per second by default.
On the bottom of the screen is the Status Bar, which displays information about the system’s resource usage and the number of processes running.