Collect performance counters
All performance counters that are available in Windows Performance Monitor are also available to Splunk. You can collect performance data from both the local and remote hosts. Splunk allows you to analyse the collected data and ensure that your systems are running without a downtime.
Here are the steps to collect performance data from a local Windows machine:
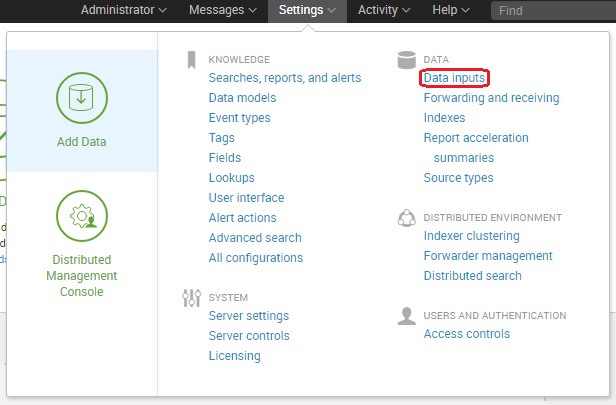
Go to Settings > Data inputs:
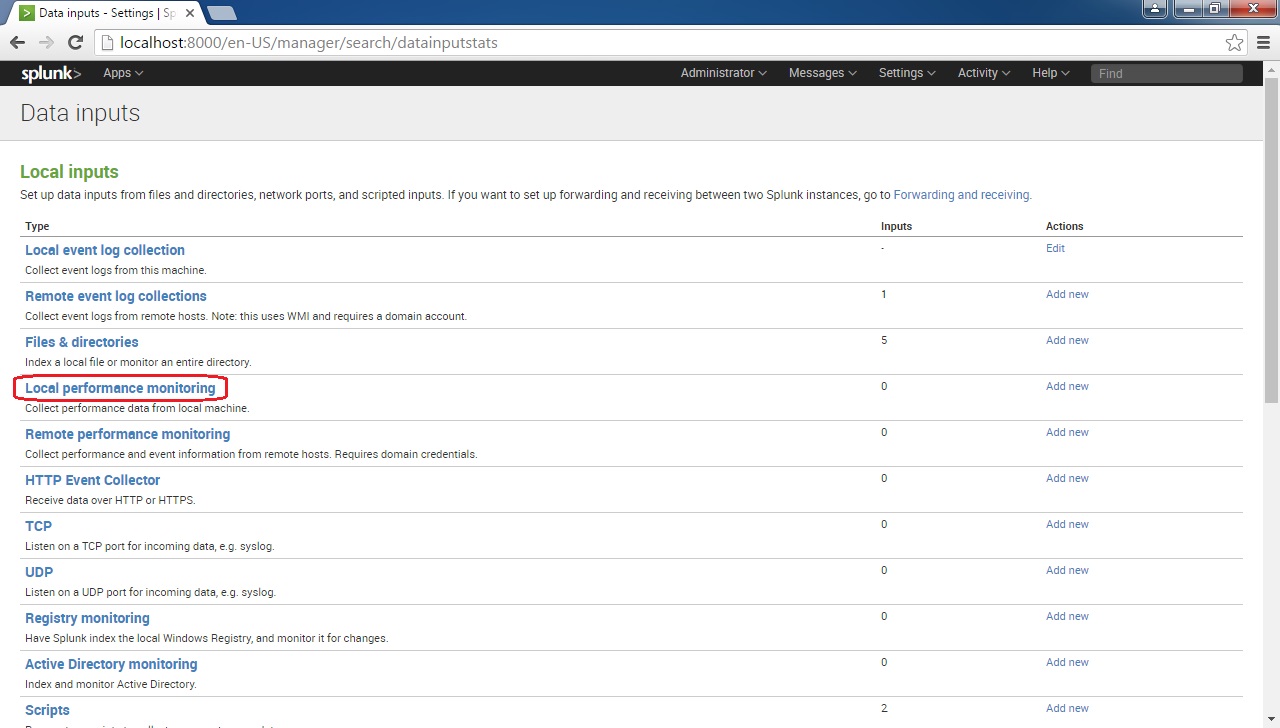
Click Local performance monitoring:
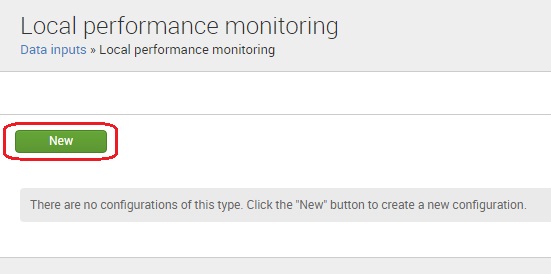
Click New to create a new configuration:
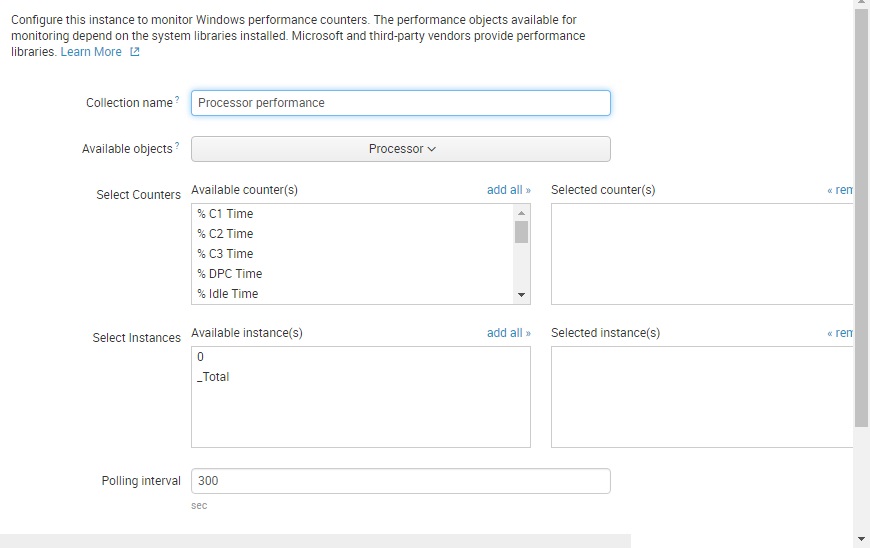
Enter the name of the collection under the Collection name field. Under the Available objects field, click Select Object and choose the object that you want to monitor. This will open up two boxes: Select Counters and Select Instances. Note that you can select only one performance object per data input. We’ve selected the Processor performance object:
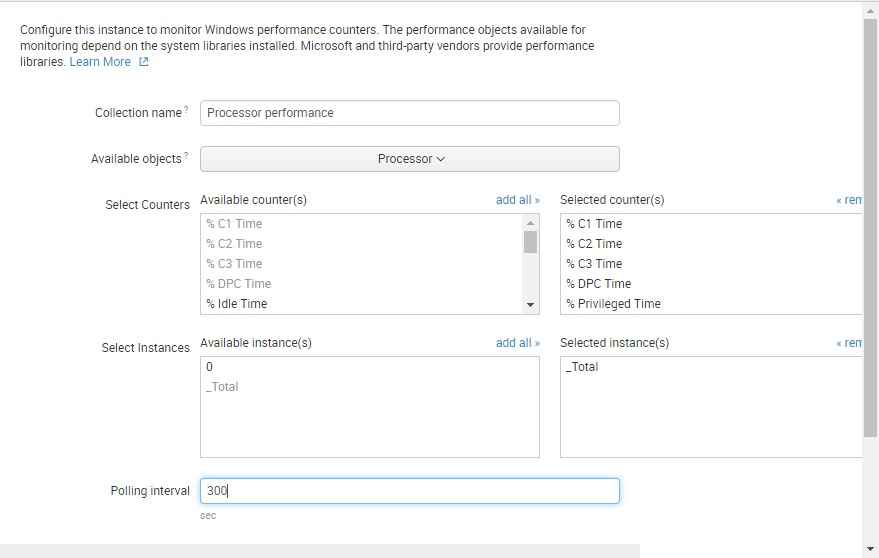
In the Select Counters list box, select the performance counters you want this input to monitor. In the Select Instances list box, select the instances that you want this input to monitor. The instance called _Total represents the total processor time used on all processors. In the Polling interval field, enter the time, in seconds, between polling attempts for the input:
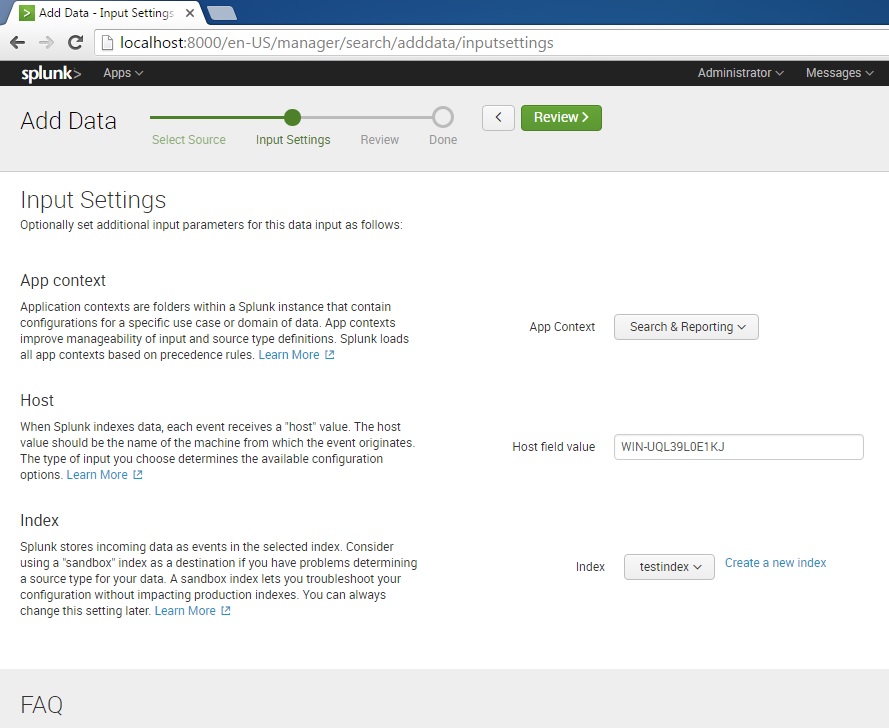
Next, you can select the App Context for this input, the host name value, and the index in which the data will be stored:
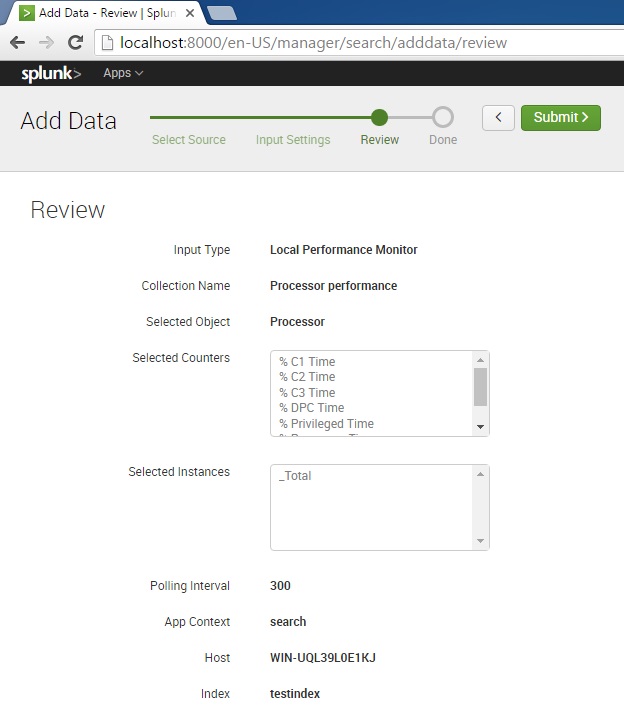
Review your selections and click Submit:
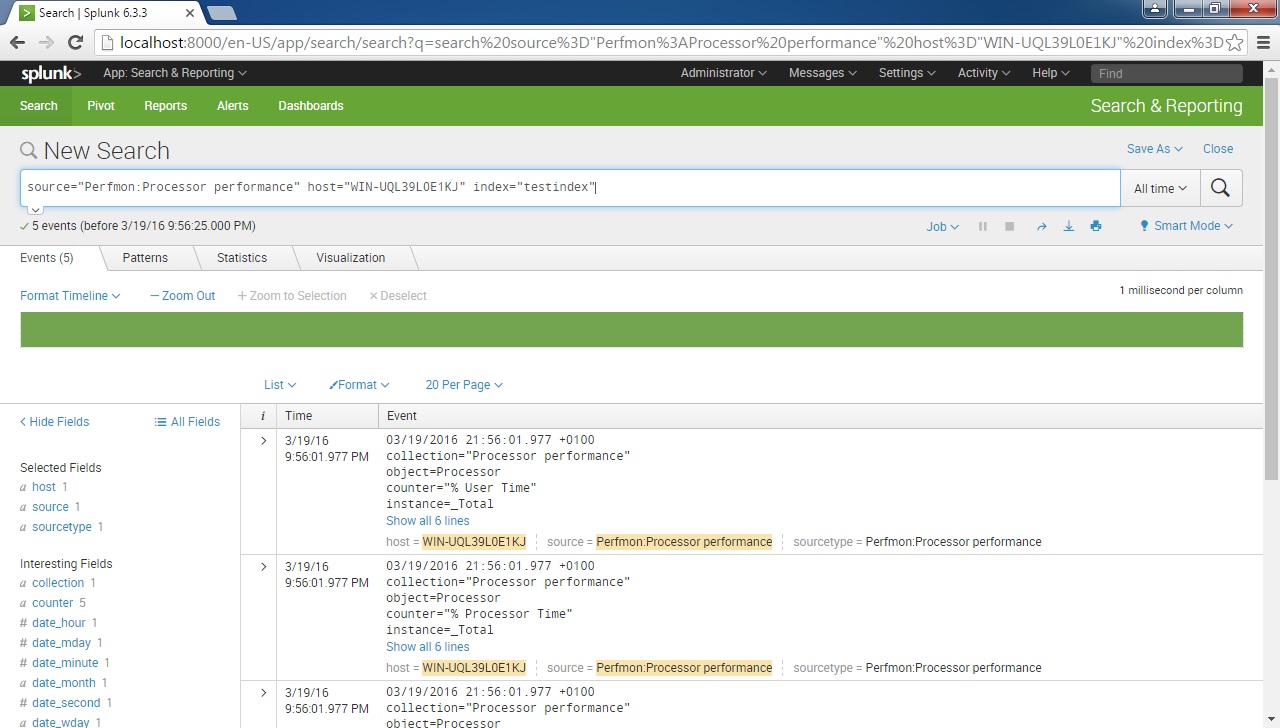
And that’s it! We can now search the performance logs we’ve collected: