Monitor network performance
You can use vCenter Server performance charts to monitor network performance. For example, you can measure outgoing and incoming network traffic from a VM or an ESXi host to get an idea of how much network traffic is being generated. Here is how you can display such statistics using vCenter Server charts:
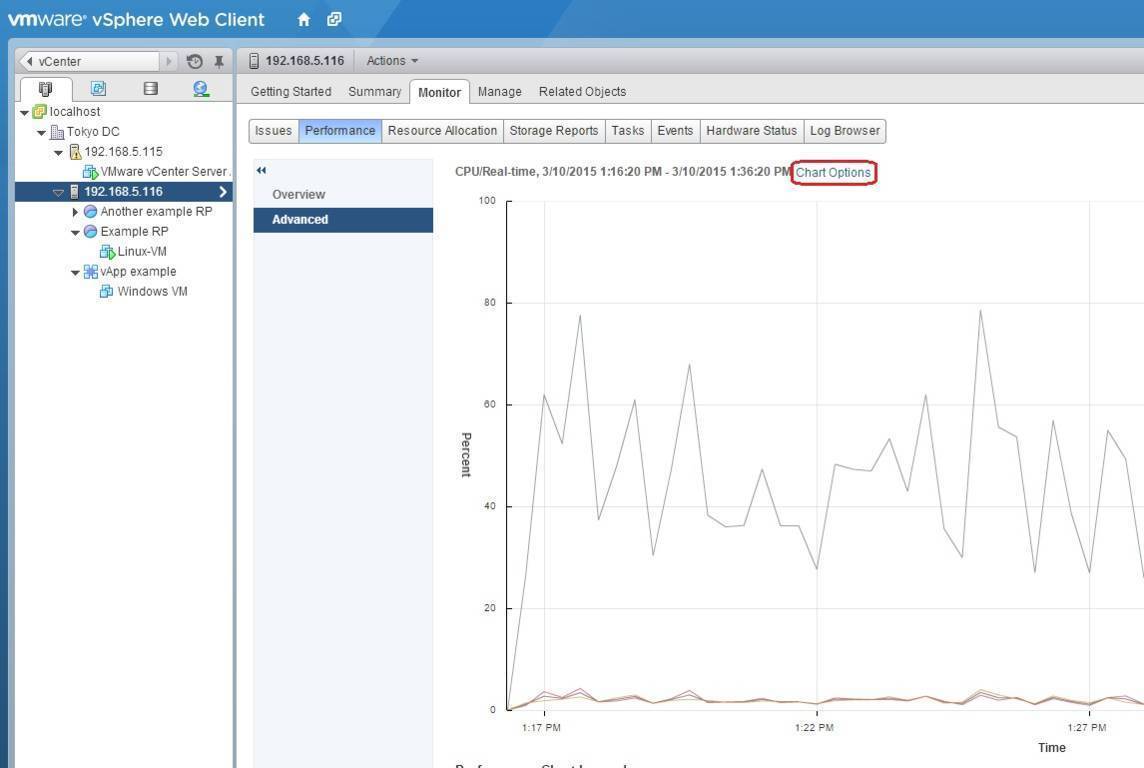
1. Select the ESXi host from the inventory and select Monitor > Performance > Advanced. In the Advanced window, click the Chart Options link:
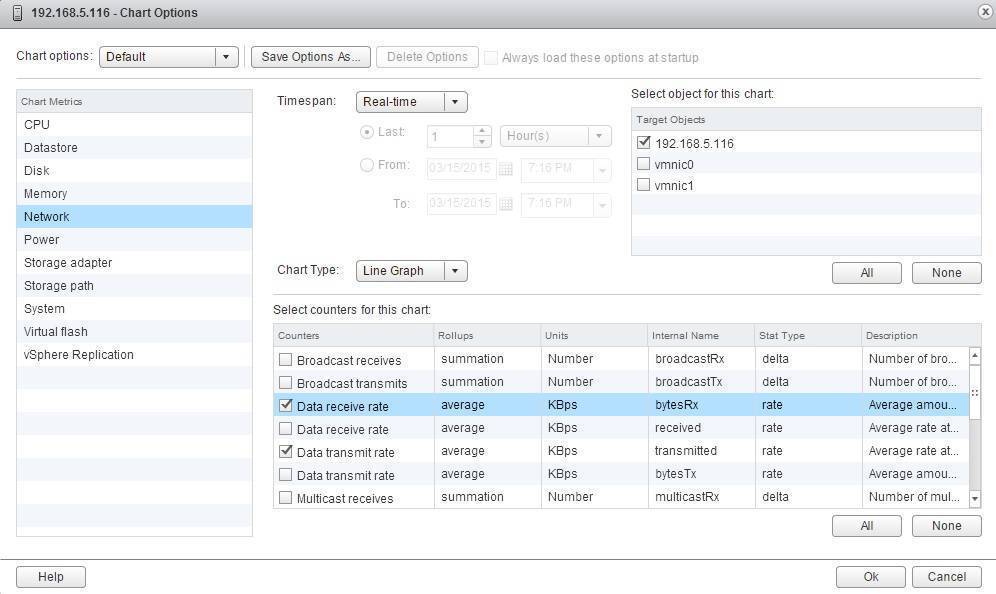
2. The Chart Options wizard opens. Select Network as the chart metric. Set the timespan as Real-time and Line Graph as the chart type. Select your ESXi host under Select object for this chart. Under Select counters for this chart, select Data receive rate, Data transmit rate, and Usage:
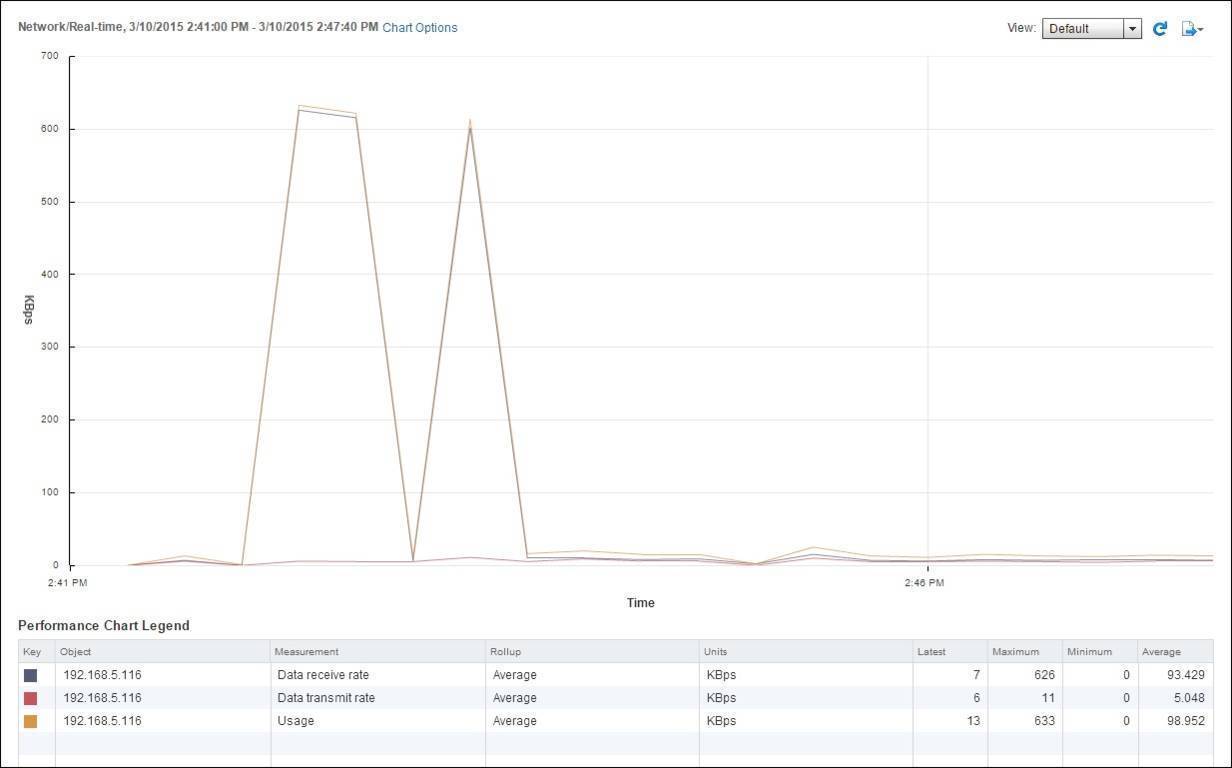
Your chart should look like the one below:


