Monitor disk usage
Disk-intensive applications can cause performance problems by saturating the storage. The two disk latency data counters that should be monitored in order to determine disk performance problems are:
- Kernel command latency – the average time spent in VMkernel per SCSI command. Numbers greater than 2 ms might indicate a problem.
- Physical device command latency – the average time the physical device takes to complete a SCSI command. Number greater than 15 ms might indicate a problem.
You can display these two values using vSphere Web Client:
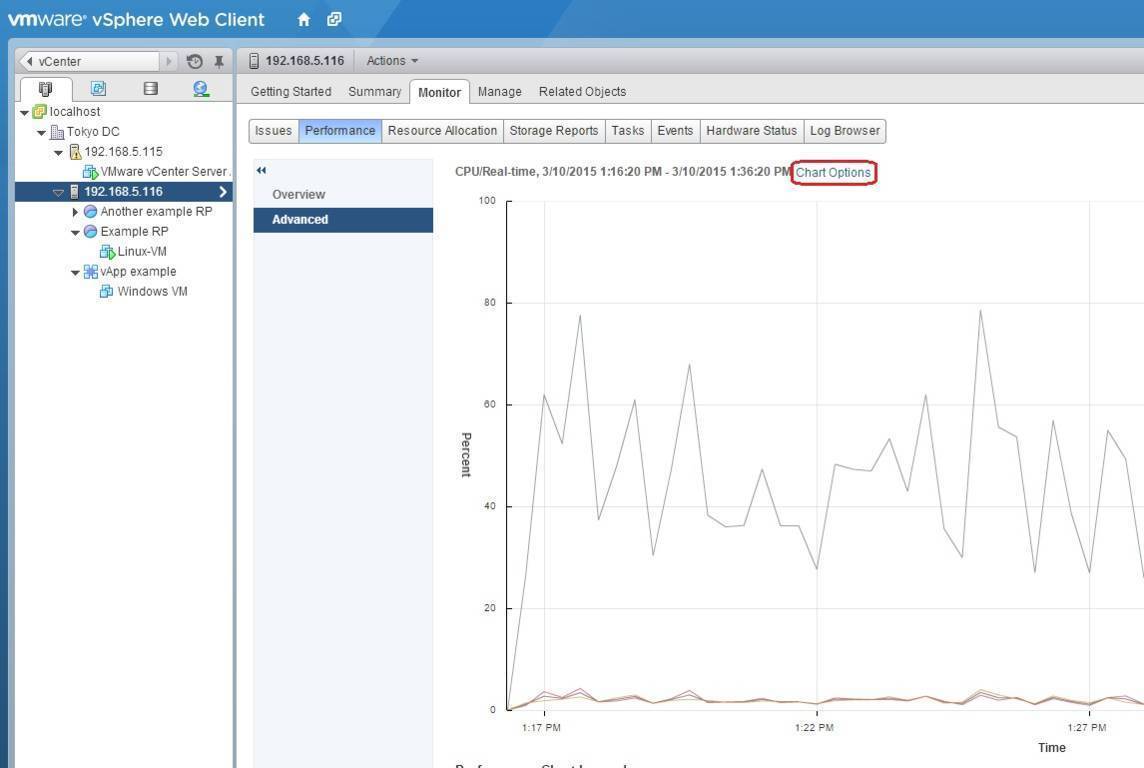
1. Select the ESXi host from the inventory and select Monitor > Performance > Advanced. In the Advanced window, click the Chart Options link:
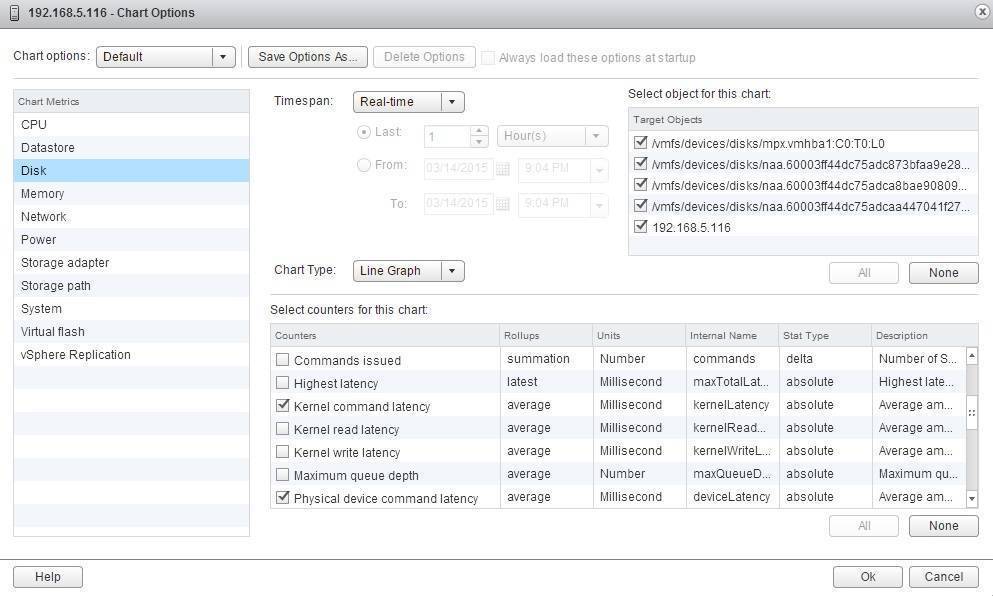
2. The Chart Options wizard opens. Select Disk as the chart metric. Set the timespan as Real-time and Line Graph as the chart type. Select the host and disk controllers under Select object for this chart. Under Select counters for this chart, select Kernel command latency and Physical device command latency:
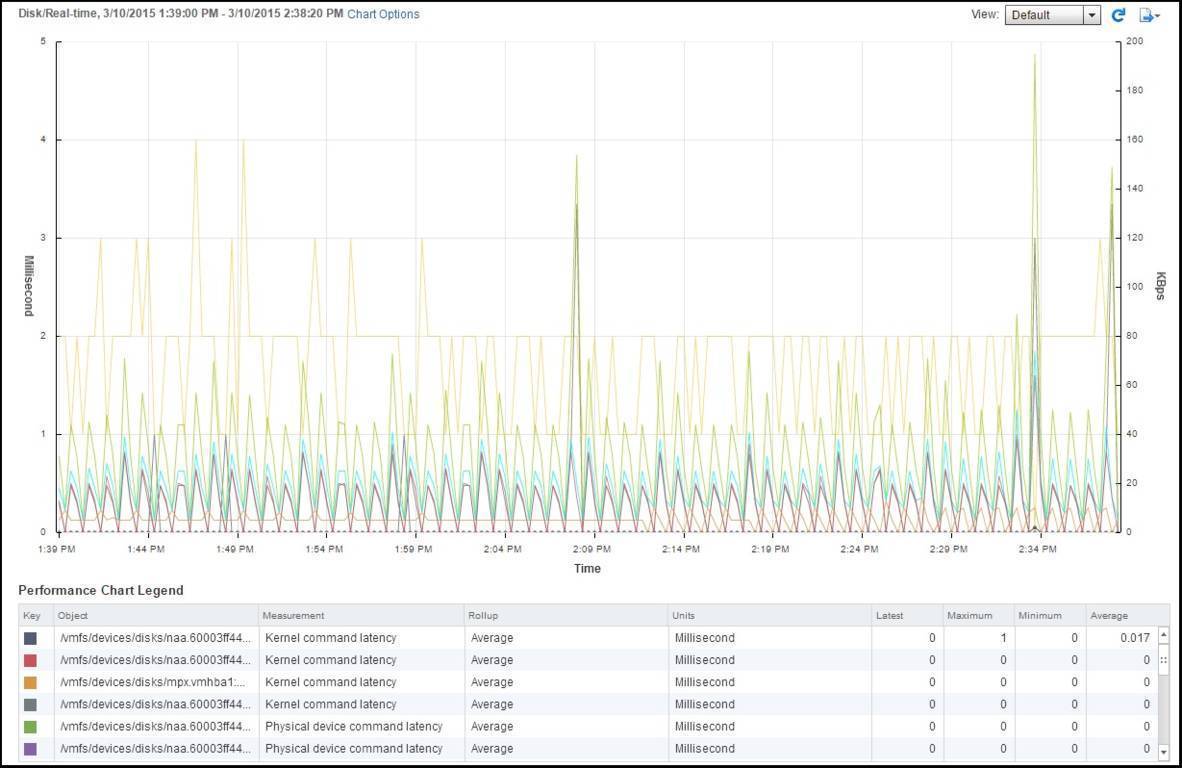
Your chart should look something like this: