Performance charts in vCenter Server
vCenter Server offers various performance charts for ESXi hosts and virtual machines. These charts can help you determine whether a VM is contrained by a resource or they can used for trend analysis. Two kinds of charts are available: Overview charts and Advanced charts.
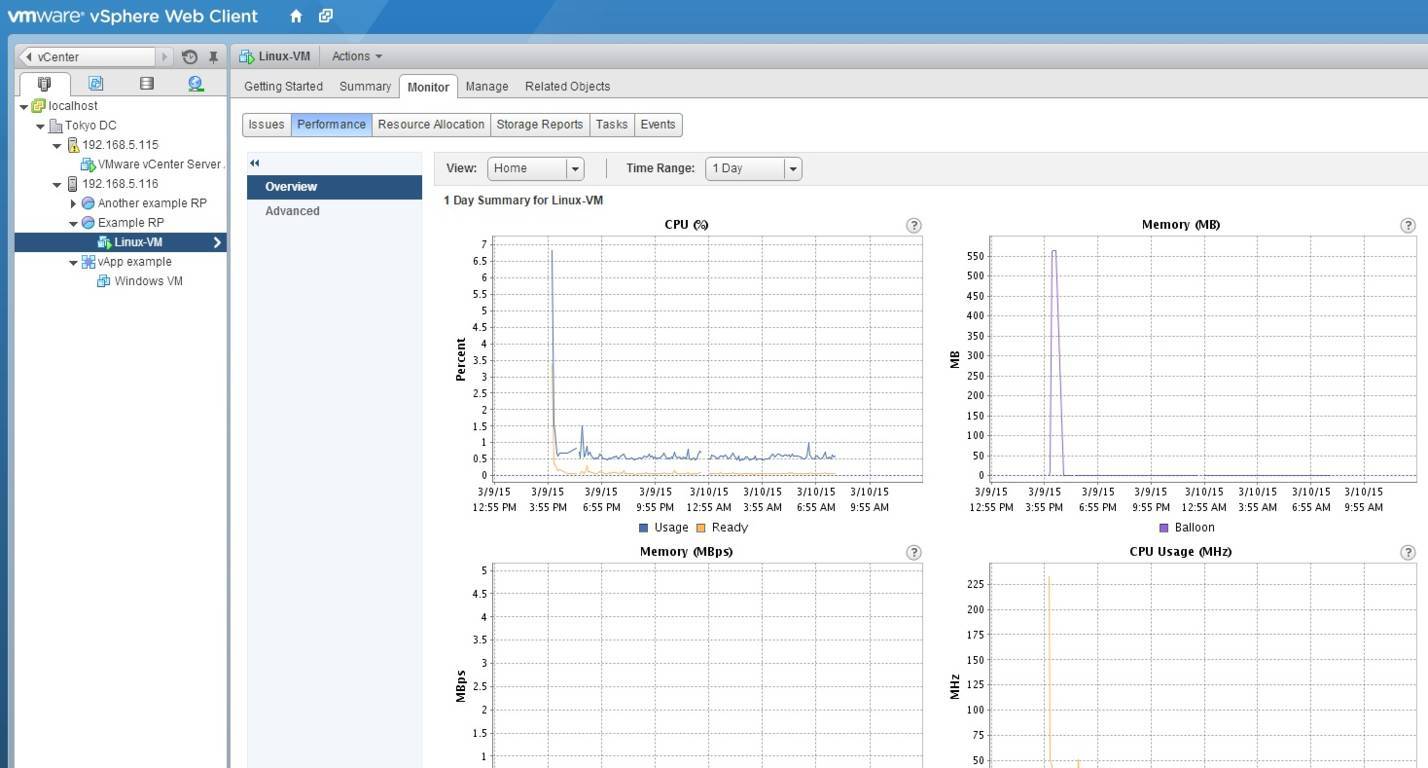
Overview charts
Overview charts provide a summary view of how your ESXi host or virtual machine are doing. These charts consist of a predefined view that can be selected from a drop-down menu.
To access the Overview charts from vSphere Web Client , select your VM or ESXi host from the inventory and go to Monitor > Performance:
Advanced charts
Advanced charts are extremely customizable and can display data counters not shown in the overview charts. They can also be exported or printed.
To access the Advanced charts from vSphere Web Client, select your VM or ESXi host from the inventory and go to Monitor > Performance > Advanced:
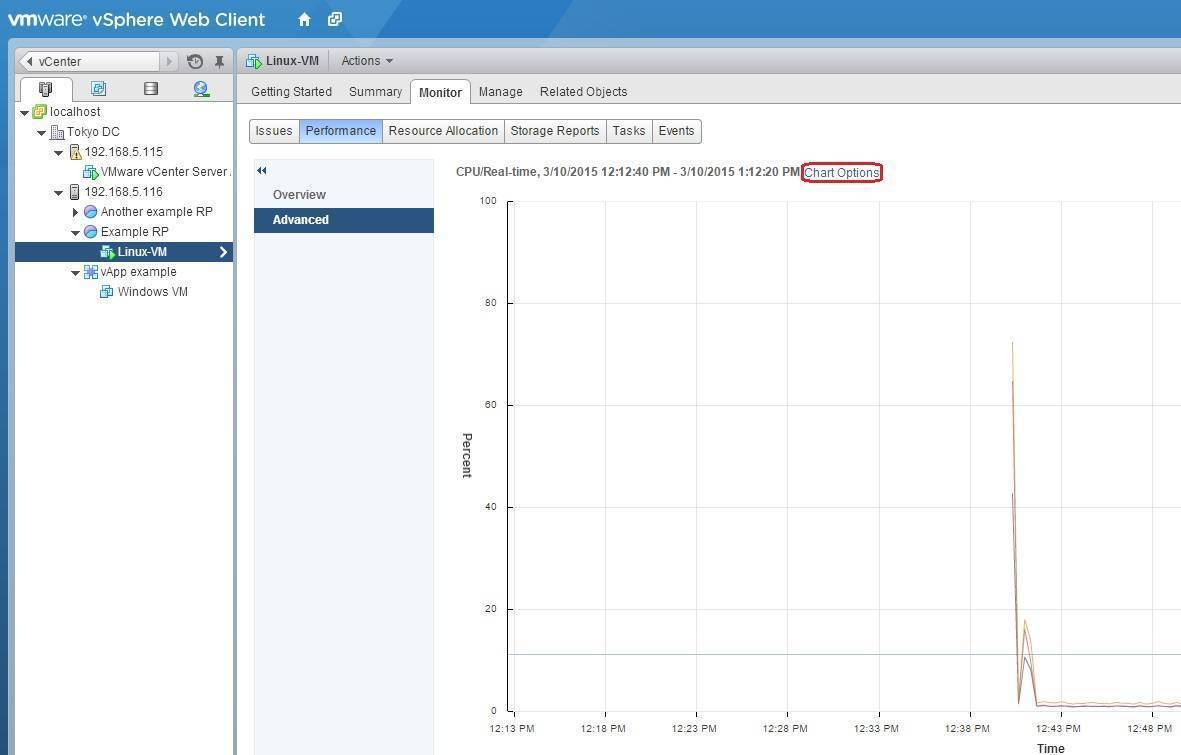
Click the blue Chart Options link to create a custom chart.