List processes in real-time
Like the ps command, the top command is used to list processes currently running on your system. But top has one advantage over ps – it updates its display every couple of seconds, so you can see how the resource usage changes in almost real-time.
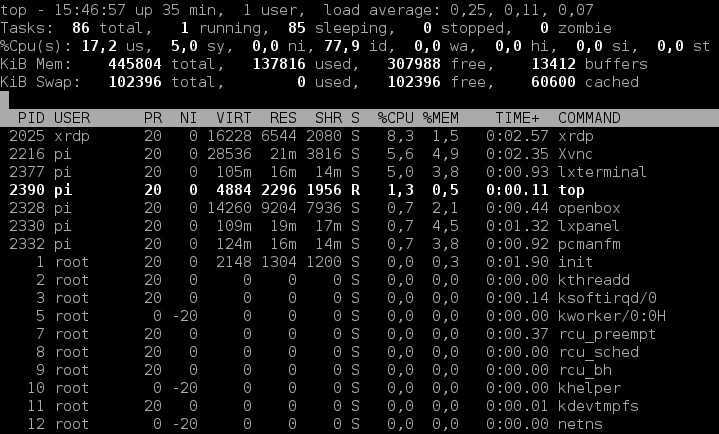
Consider the following top output (to invoke the command, simply type top in the terminal):
As you can see from the picture above, the top command displays a variety of useful information about processes. Here is a brief description of the most important ones:
- PID – the process ID of the process.
- USER – the owner of the process.
- PR – the priority of the process.
- NI – the nice value of the process.
- VIRT – the total amount of virtual memory used by the process.
- RES – the non-swapped physical memory the process has used.
- %CPU – the processor’s share of the CPU time.
- %MEM – the processor’s share of the physical memory.
- COMMAND – the command used to start the process.
By default, top sorts its entries by CPU usage, but you can sort the entries by other columns as well:
- to sort by memory usage, press M.
- to reverse sort the output, press R.
- to sort by the CPU usage, press P.
- to sort by other fields, use the < and > keys.
Kill processes with top
You can also kill processes while in the top window. For example, if you notice that a running process is using too much CPU time, you can kill it by pressing k and specifying the PID.


