Monitor CPU utilization
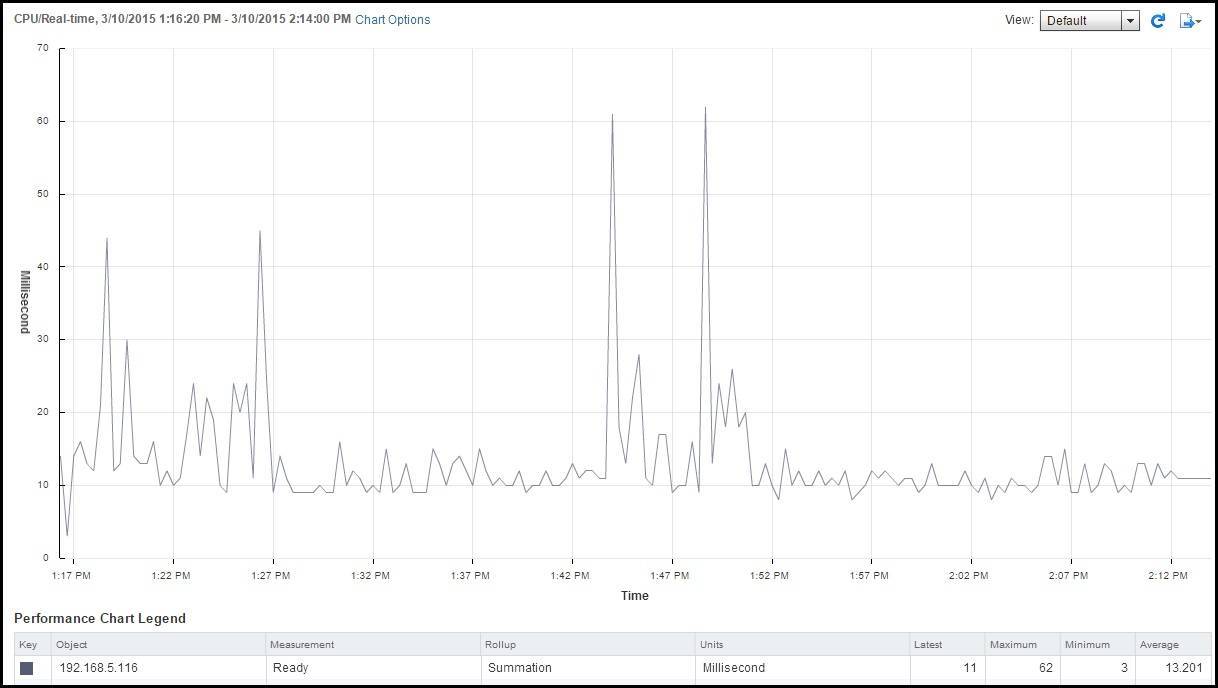
It’s always a good thing to keep an eye on the CPU utilization. If the CPU usage is continously high, the VM might be constrained by CPU. A good indicator of a CPU-constrained virtual machine is the CPU ready time value. This value shows how long a VM is waiting to be scheduled on a logical processor. The value varies from workload to workload, but a VM waiting time of thousands of milliseconds might indicate that the ESXi host is overloaded or that the VM doesn’t have enough CPU shares.
You can display the CPU ready time values using vSphere Web Client:
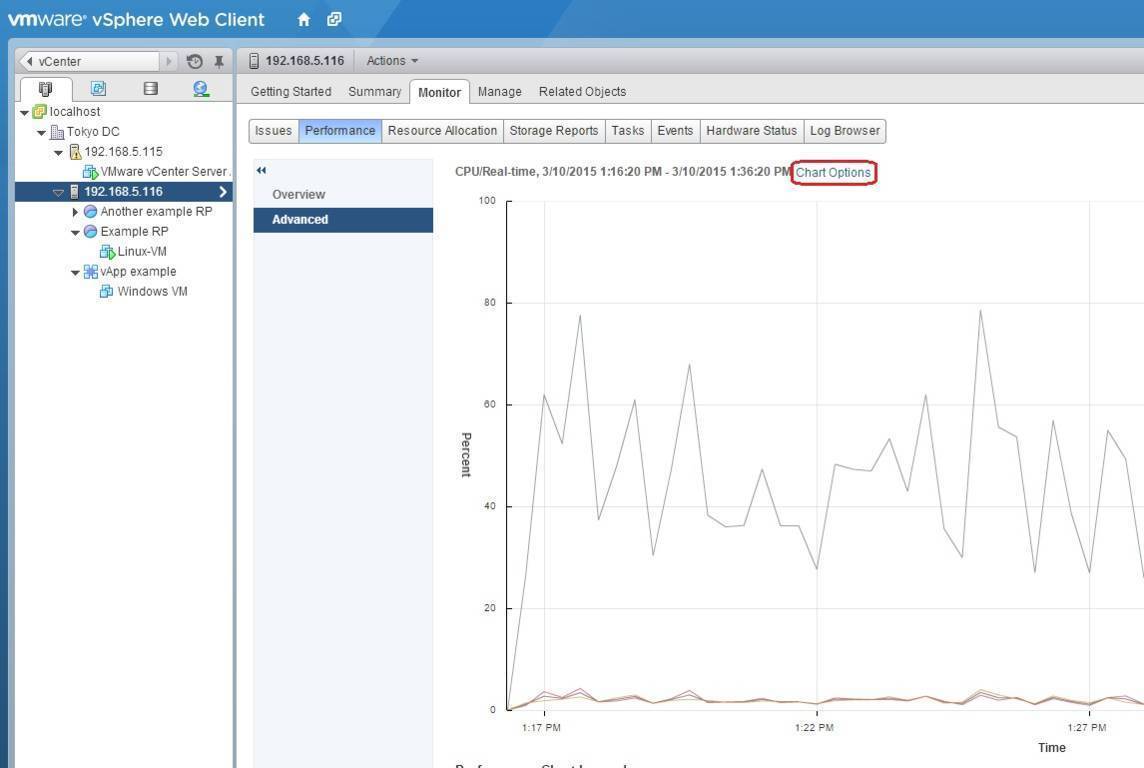
1. Select the ESXi host from the inventory and select Monitor > Performance > Advanced. In the Advanced window, click the Chart Options link:
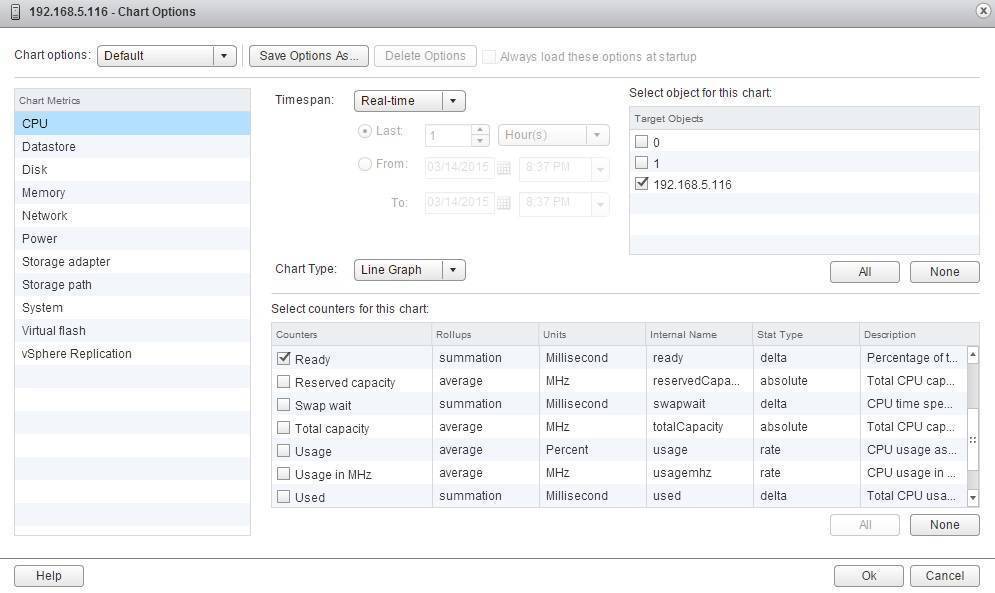
2. The Chart Options wizard opens. Select CPU as the chart metric. Set the timespan as Real-time and Line Graph as the chart type. Select only your ESXi host under Select object for this chart. Under Select counters for this chart, select Ready:
Your chart should look like this one below:


