Interpret scan results
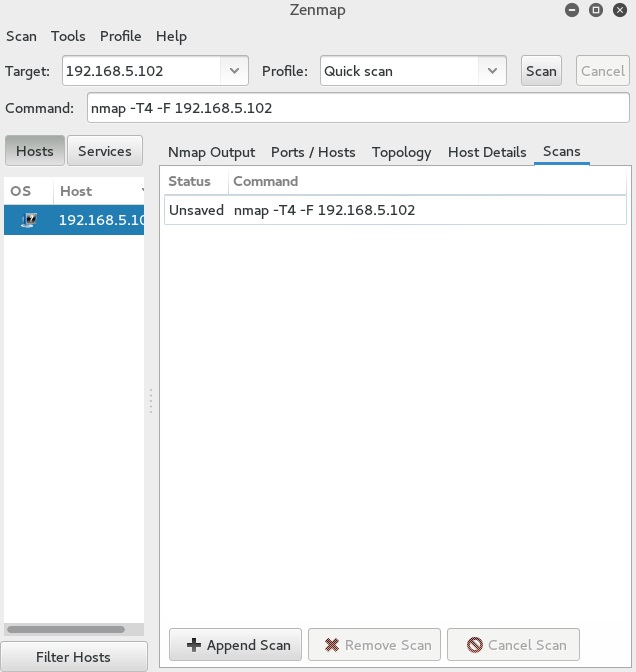
Let’s interpret the results of the following Zenmap scan:
We’ve run a quick scan against a host with the IP address of 192.168.5.102. A scan window contains five tabs, each displaying different aspects of the scan results:
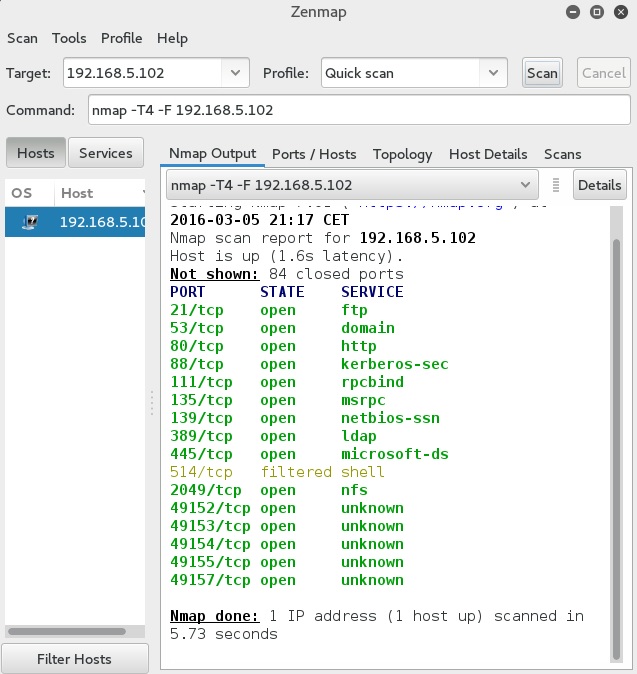
Nmap Output – displayed by default when a scan is run. The scan results were outputted in the familiar Nmap terminal output. Notice that the output was highlighted; for example, open and closed ports were displayed in different colors.
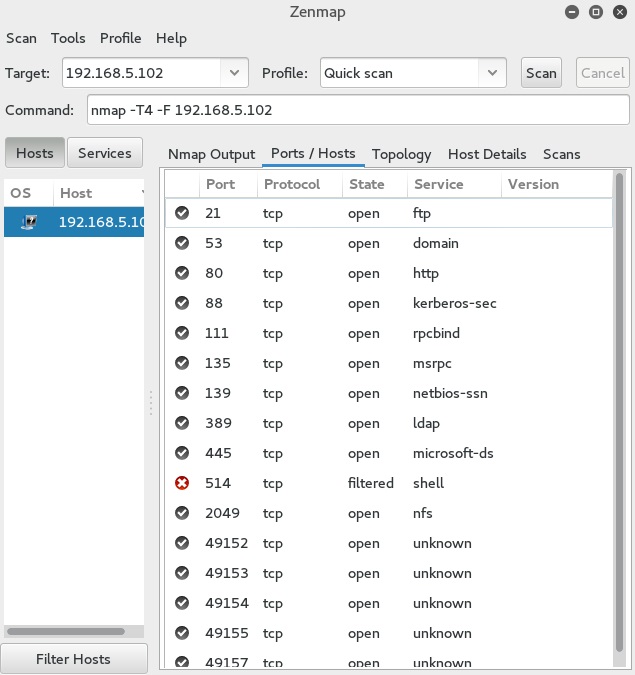
Ports/Hosts – this tab’s display differs depending on whether a host or a service is selected. When a host is selected, it shows all the interesting ports on that host (pictured below). When a service is selected, this tab shows all the hosts which have that port open or filtered:
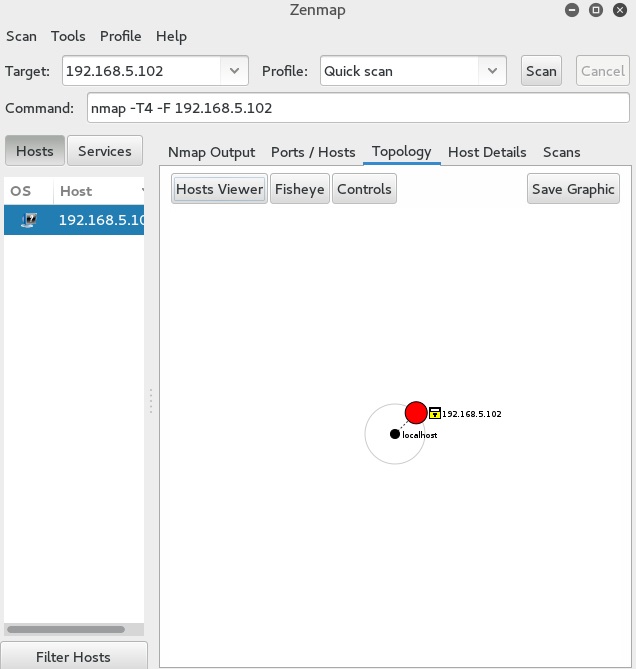
Topology – displays an interactive view of the connections between hosts in a network:
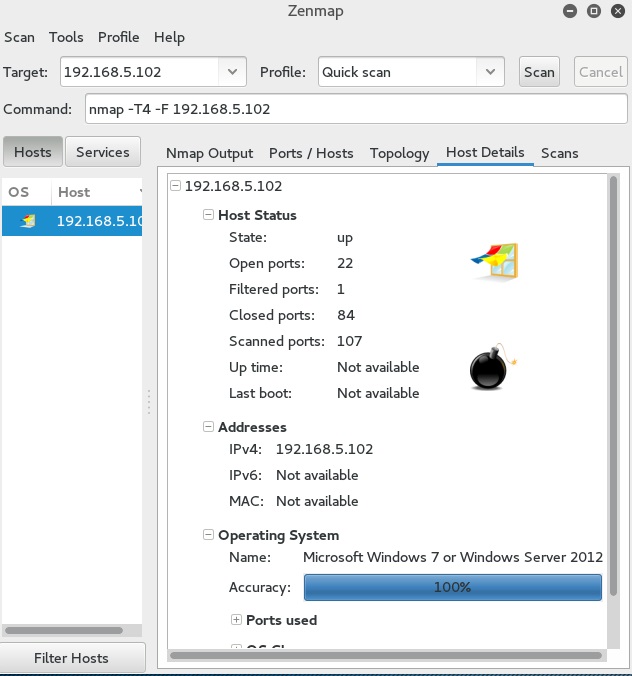
Host Details – displays information about a target host, such as the hostnames and addresses, its state (up or down), the number and status of scanned ports, etc:
Scans – shows the scan that was used: