A short introduction to… Process Explorer

Written by Tuna Peyo on November 1, 2019
Process Explorer is a free task manager and system monitor software for the Windows operating systems. It is a part of the SysInternals suite of products, which consists of a set of tools that help you manage, monitor, troubleshoot and diagnose your Windows systems and applications. This suite was developed by the company Winternals Software LP, which was later acquired by Microsoft.ana
Process Explorer can be thought of as a more powerful Task Manager, a program usually used to get information about computer performance and resource usage. Process Exporer offers many features not present in Task Manager – it will show you the detailed information about each process, provide you the CPU usage tracking for processes, figure out which process has loaded a DLL file, enable you to to kill or suspend a process, interactively set the priority of a process, and much more.
Install and run Process Explorer
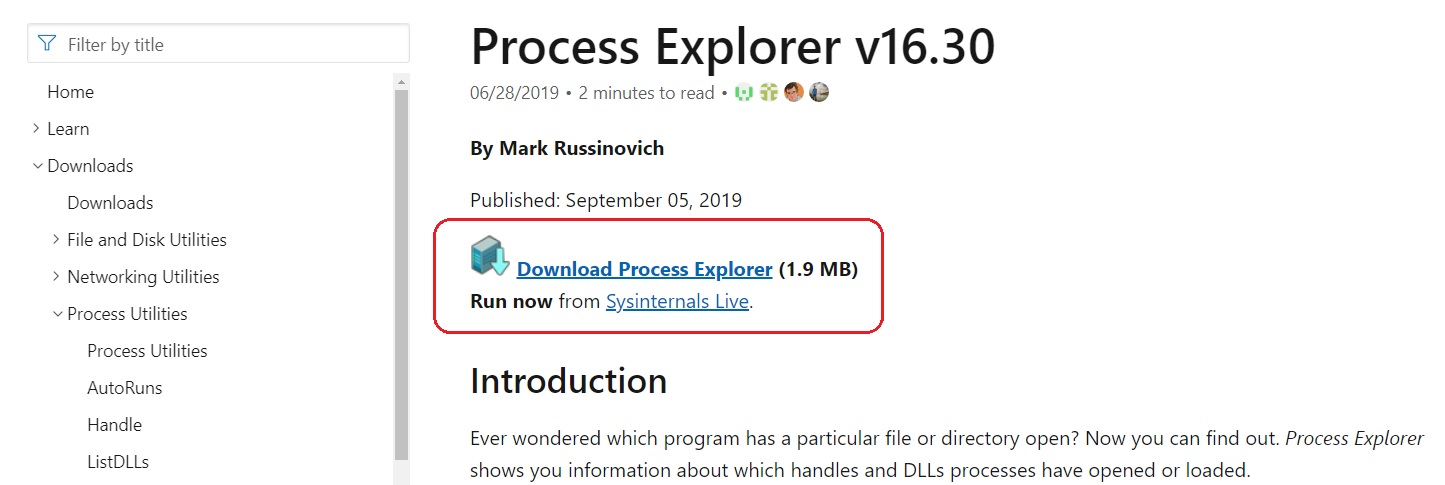
Process Explorer can be downloaded for free. To do that, go to this link and click the Download Process Explorer link on the right:
The downloaded zip file is really small and includes only four files:
- Eula.txt – Sysinternals Software license terms
- procexp.chm – the official help file
- procexp.exe – the executable (32-bit Windows)
- procexp64.exe – the executable (64-bit Windows)
To start the program, simply double-click the procexp64.exe file – there is no installation at all! You simply need to accept the license agreement the first time you run the program and you are ready to go.
Procexp tree view
The first time you run Process Explorer, you are presented with the default Procexp window. This window consists of a process list, with processes arranged in a tree view:
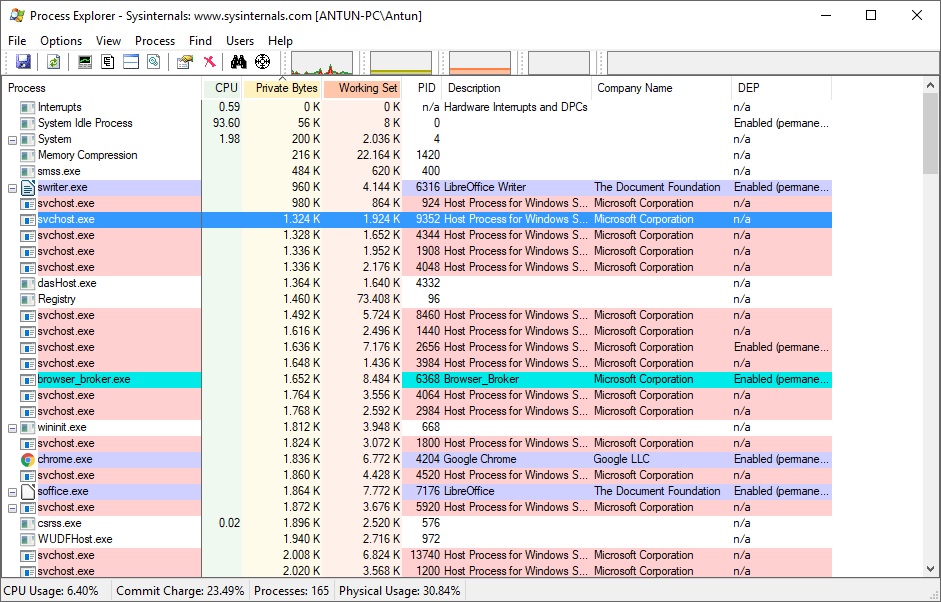
In the main window, you have this set of columns:
- Process – the file name of the executable (also includes the icon if one exists).
- CPU – the percentage of CPU time in the last second.
- Private Bytes – the amount of memory allocated to the program alone.
- Working Set – the amount of actual RAM allocated to the program.
- PID – the process identifier that identifies an active process.
- Description – process description, if available.
- Company Name – the name of the company that created the software that started the process.
- DEP – the status of Data Execution Protection, which prevents malicious code from running
You can customize these columns and add others, or you can click on any of the columns to sort by that field. By default, the view is updated once per second.
On the top of the screen there are activity graphs displaying the CPU, memory, I/O, network and disk usage. These graphs can be clicked on to be displayed in separate windows. On the bottom of the screen is the Status Bar, displaying information about the system’s resource usage and the number of processes running.
Process Tree
The Process column displaying the list of processes is displayed on the left side of the screen. You can sort it in three ways: ascending, descending, and Process Tree. Clicking on the Process header will flip between sorting by the process name, or going back to the Process Tree view, which is the default.
The Process Tree view displays the processes’ parent/child relationships. Whenever a process creates another process, Windows puts the process ID of the creating process (the parent) into the internal data structure of the created process (the child). Procexp uses this information when building its tree view. Processes that have no existing parent are left-aligned in the column. You can collapse or expand portions of the tree by clicking the plus and minus icons to the left of parent processes in the tree, or by selecting these nodes and pressing the left and right arrow keys.
Clicking the Process header cycles through an ascending sort by process name, a descending sort, and the tree view. For example, to sort the processes by name in the alphabetical order, you would click the Process header once:

Process actions
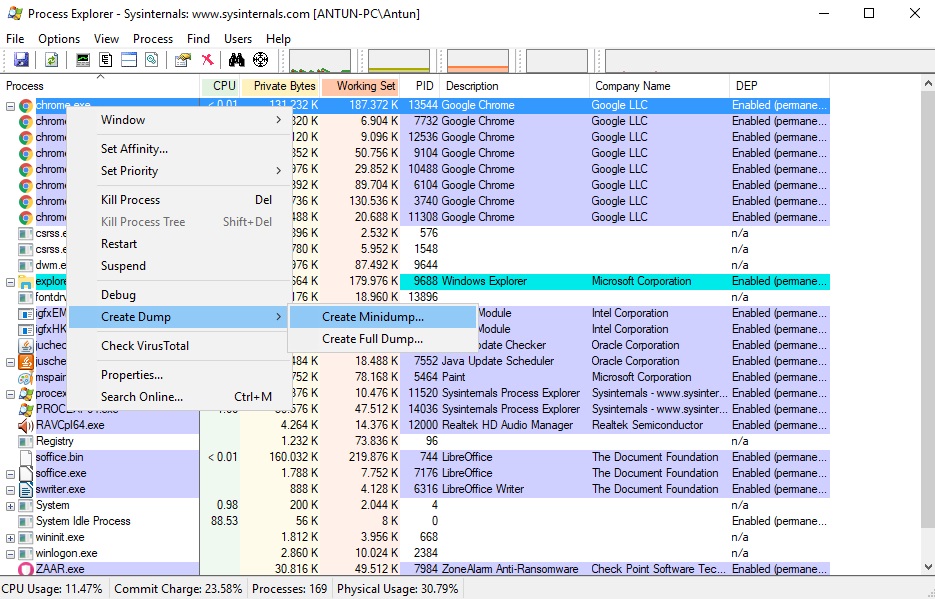
By right-clicking on a process in the list, you can get a list of actions you can perform on it:
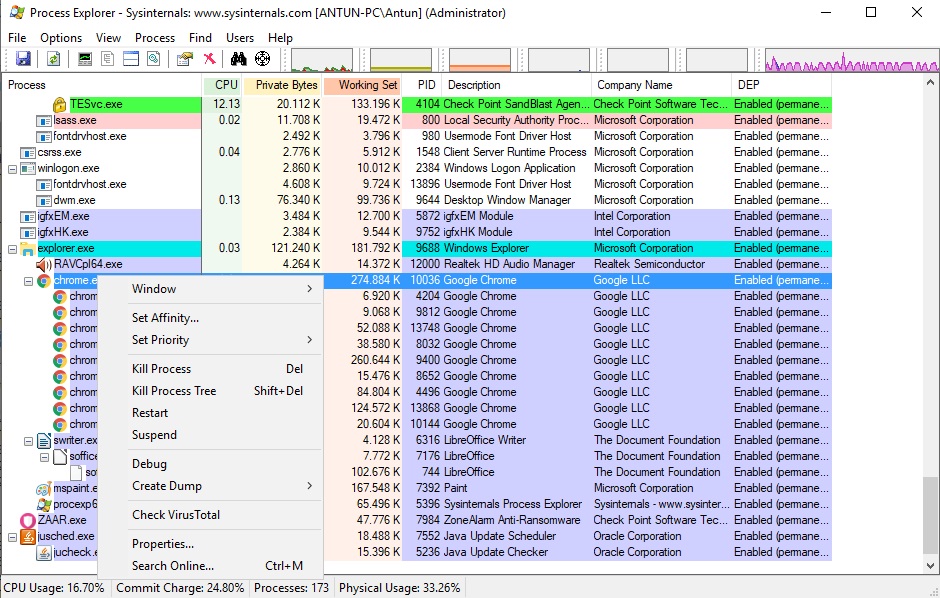
Here is a description of these actions:
- Window – if the process owns a visible window on the desktop, this submenu lets you bring it to the foreground, restore, minimize, maximize, or close it. If there are no windows for the process, the option is grayed out.
- Set Affinity – on multi-CPU systems, you can set processor affinity for a process so that its threads will run only on the CPU(s) you specify.
- Set Priority – used to configure the base scheduling priority of a process. Set a higher priority if you wish the process to get more CPU resources.
- Kill Process – this option allows you to kill the process. Procexp will ask you for confirmation before killing the process.
- Kill Process Tree – kills not just the item in the list, but also the children of that parent process.
- Restart – kills the process and then starts it again.
- Suspend – forces a process to become temporarily inactive so that a system resource becomes available for other processes. To resume a suspended process, choose the Resume item from the process context menu.
- Create Dump – this option lets you capture a minidump or a full memory dump for troubleshooting purposes.
- Check VirusTotal – allows you to check the process for viruses using virustotal.com.
- Properties – displays useful information about the process.
- Search Online – this option will just search the web for the name of the process.
Kill a process
One of the commonly performed actions in Procexp is killing a process. You can forcibly terminate (kill) the selected process. You might want to use this option if a process is stuck or is taking too much resources. By default, Procexp prompts you for confirmation before terminating the process:
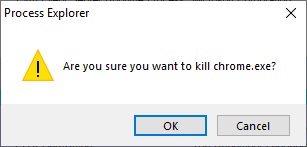
Note that killing a process this way does not give the process an opportunity to shut down cleanly, and can cause system instability or data loss. In addition, Procexp does not provide extra warnings if you try to terminate a system-critical process (e.g. csrss.exe). Terminating such process can lead to system
Suspend a process
You can use the Suspend action in Procexp to force a process to become temporarily inactive. This option frees system resources (such as network, CPU, or disk) for other processes. The Suspend option is also useful when you need to perform diagnostics on a program or if you need to inspect what a suspected malware program is doing to your system. To suspend a process, right-click on it and select Suspend:

Note that if a suspended processes was running a visible application, the application window can’t be minimized, resized or moved. To resume a suspended process, simply right-click the process again and select the Resume item from the process context menu.
Create dump files
A process dump consists of the recorded state of the working memory of a computer program at a specific time. A dump is usually captured when the program has crashed or otherwise terminated abnormally. By examining process dumps, you can make a complete analysis for why a process crashed.
Procexp allows you to capture a minidump or a full memory dump. You can do this by right-clicking a process and selecting either the Create Minidump or Create Full Dump option:
Identify the process that owns a window
You can use the crosshair icon in the Procexp toolbar to identify a process that owns a window. First, click and hold the crosshair icon:
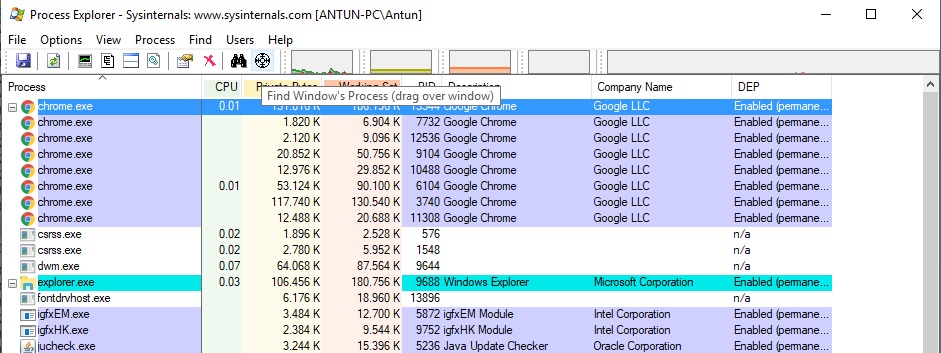
Procexp should move itself behind all other windows. Next, drag the crosshair icon over the window you are interested in and release it. Procexp will reappear and the process that owns the window selected should be selected in the main window.
System Information window
The Procexp’s System Information window is similar to the one present in Task Manager. It can be accessed by choosing View > System Information or using the Ctrl+i shortcut:
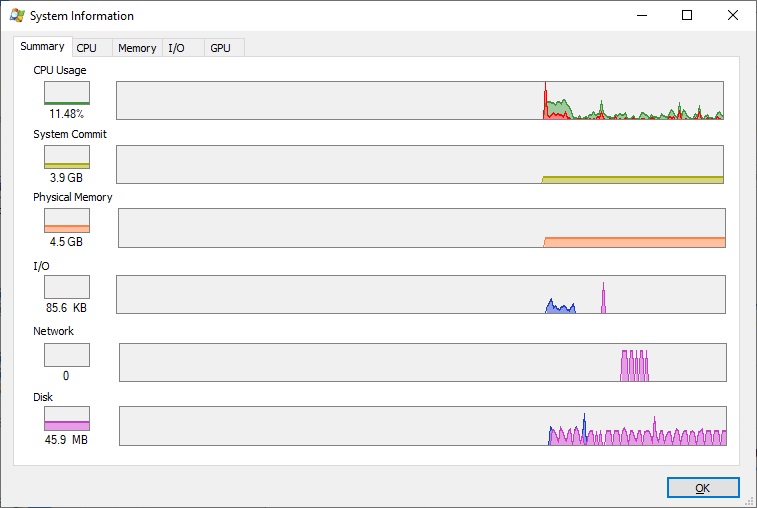
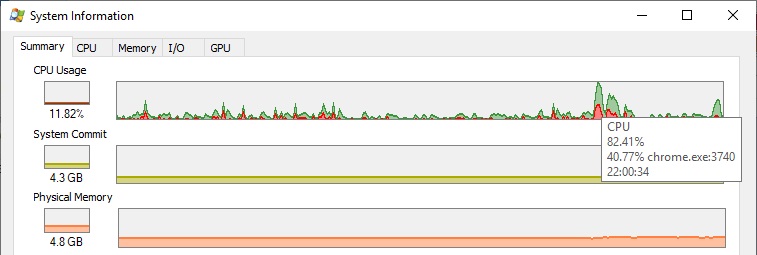
As you can see in the picture above, the Summary tab contains six graphs representing systemwide metrics that are shown in more detail on the CPU, Memory, I/O, and GPU tabs. On the left of each graph there is the current level in graphical and numeric form. The graph on the right shows recent history. Moving the mouse over the history graphs displays a tooltip containing the time of day represented at that point in the graph. For the CPU Usage and I/O graphs, the tooltip also indicates which process was consuming the most of resources at that point in time:
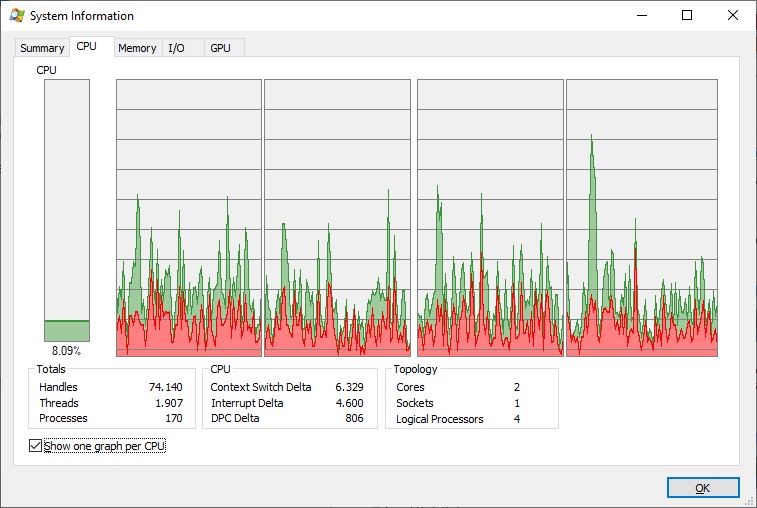
Under the CPU tab of the System Information window, the red area displays the percentage of time spent executing in kernel mode; the area under the green line represents total CPU utilization as a percentage:
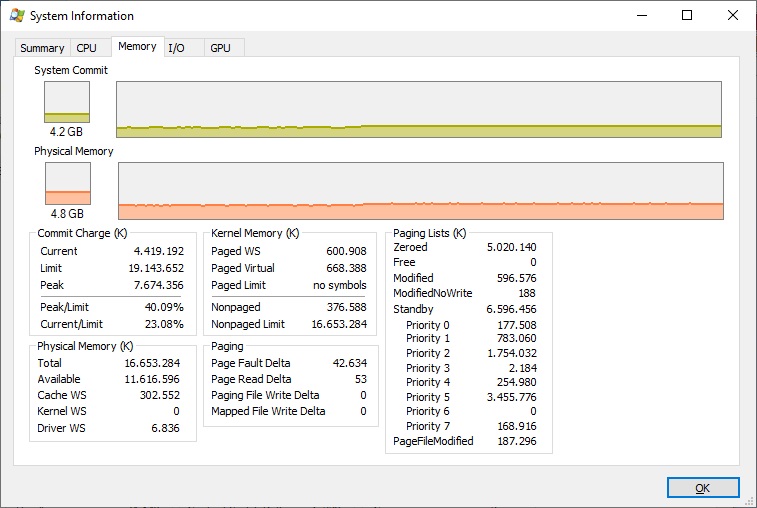
The Memory tab of the System Information window contains the System Commit and Physical Memory graphs. In the Commit graphs, the area under the yellow line indicates the commit charge – the total amount of private bytes committed across all processes, plus the paged pool. The Physical Memory graphs indicates the amount of physical RAM in use by the system. The lower part of the tab shows some memory-related metrics:
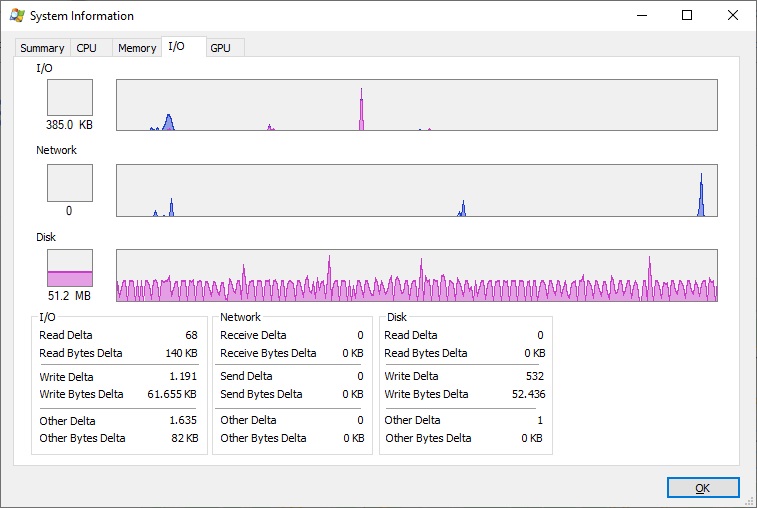
The I/O tab of the System Information window displays I/O Bytes, Network Bytes and Disk Bytes. I/O Bytes represents the amount of file and device I/O throughput, Network Bytes represents network I/O, and Disk Bytes represents the I/O throughput to local disks. The lower part of the tab displays the number of I/O and Disk Read, Write, and Other operations and Network Receive, Send, and Other operations since the last data refresh:
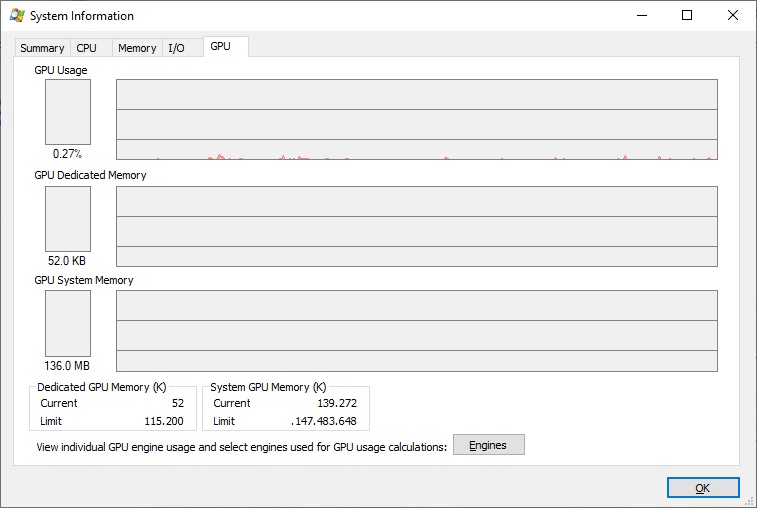
On Windows Vista and newer Windows systems, there is also a GPU tab, which displays GPU graphs that show GPU utilization:
Replace Task Manager with Process Explorer
Since Procexp provides more useful information than Task Manager, you might want to use Procexp exclusively and never use Task Manager again. By enabling the Replace Task Manager option under the Options tab, you can make Process Explorer replace Task Manager. This will ensure that using CTRL + SHIFT + ESC or right-clicking on the Taskbar and selecting Task Manager will both launch Process Explorer rather than Task Manager:

To restore the ability to run Task Manager, deselect the Replace Task Manager in the Options menu.
Further reading
Take our free Process Explorer course here.